by Pavel Simakov 2006-05-07
Introduction
Java's garbage collection (GC) has made life easier, perhaps, immeasurably, for developers. However, automatic memory management does not come without costs. Garbage collection cycles are unpredictable and applications may be susceptible to "pauses" or other performance issues while garbage collection is taking place. As the Java Virtual Machine (JVM) has matured, there have been improvements introduced to minimize the impact of GC on applications. For example, you can now choose what kind of GC to use for your application. As we'll see later, the GC choices you make can have dramatic consequences.
Which GC options to choose? I was faced with this question recently when I needed to tune a Sun 1.4.2 JVM for one of my projects. There are many JVM options to choose from. Despite the existence of any number of great articles {1, 2, 3, 4, 5} describing these, I still had a very difficult time deciding which options should be used. First of all, just reading the articles required graduate level skills in statistics. It was simply impossible to definitively conclude what these options would do to my application as whole. Further, not that many tools were available to diagnose the problem. The rudimentary GC dumps are nearly useless unless you are quite familiar with the internal GC algorithms.
In this article I will show you a simple technique that actually shows how objects are created and garbage collected at runtime. Using this technique you can properly select the best garbage collection options for your application.
The crucial test
Being quite determined to get to the bottom of the garbage collection issues, I set up a small test. In this test I wanted to directly measure the impact of garbage collection on the runtime behavior of my Java application. Given that garbage collection typically causes a problem when Java objects are continuously allocated and freed, I needed to know:
- when objects are allocated
- when objects become eligible for garbage collection
- when objects are actually freed, and memory is released
The whole test consists of only a couple of dozen lines of Java code. The main thread class TestGCThread is presented in Listing 1. To avoid CPU starvation, while running, this thread enters a sleep period of variable duration (0-100 ms). After each sleep period, it creates a variable number of TestGCObject instances (0-10,000 at a time). The allocated objects can be immediately garbage collected as they are not being used further. The local variables are used to count each time an instance of TestGCObject is created in a constructor or finalized in a finalize(). The source code for TestGCObject is presented in Listing 2.
A separate test was run for each of the popular garbage collection algorithms. There are separate options controlling garbage collection of young and old generations. These options can be used individually or in specific combinations.
Young generation garbage collection algorithms are:
- Plain copying (default)
- Parallel copying (-XX:+UseParNewGC)
- Parallel scavenging (-XX:+UseParallelGC)
Old generation garbage collection algorithms are:
- Plain mark-sweep (default)
- Incremental collector (-Xincgc)
- Concurrent mark-sweep (-XX:+UseConcMarkSweepGC)
Comparing garbage collection algorithms
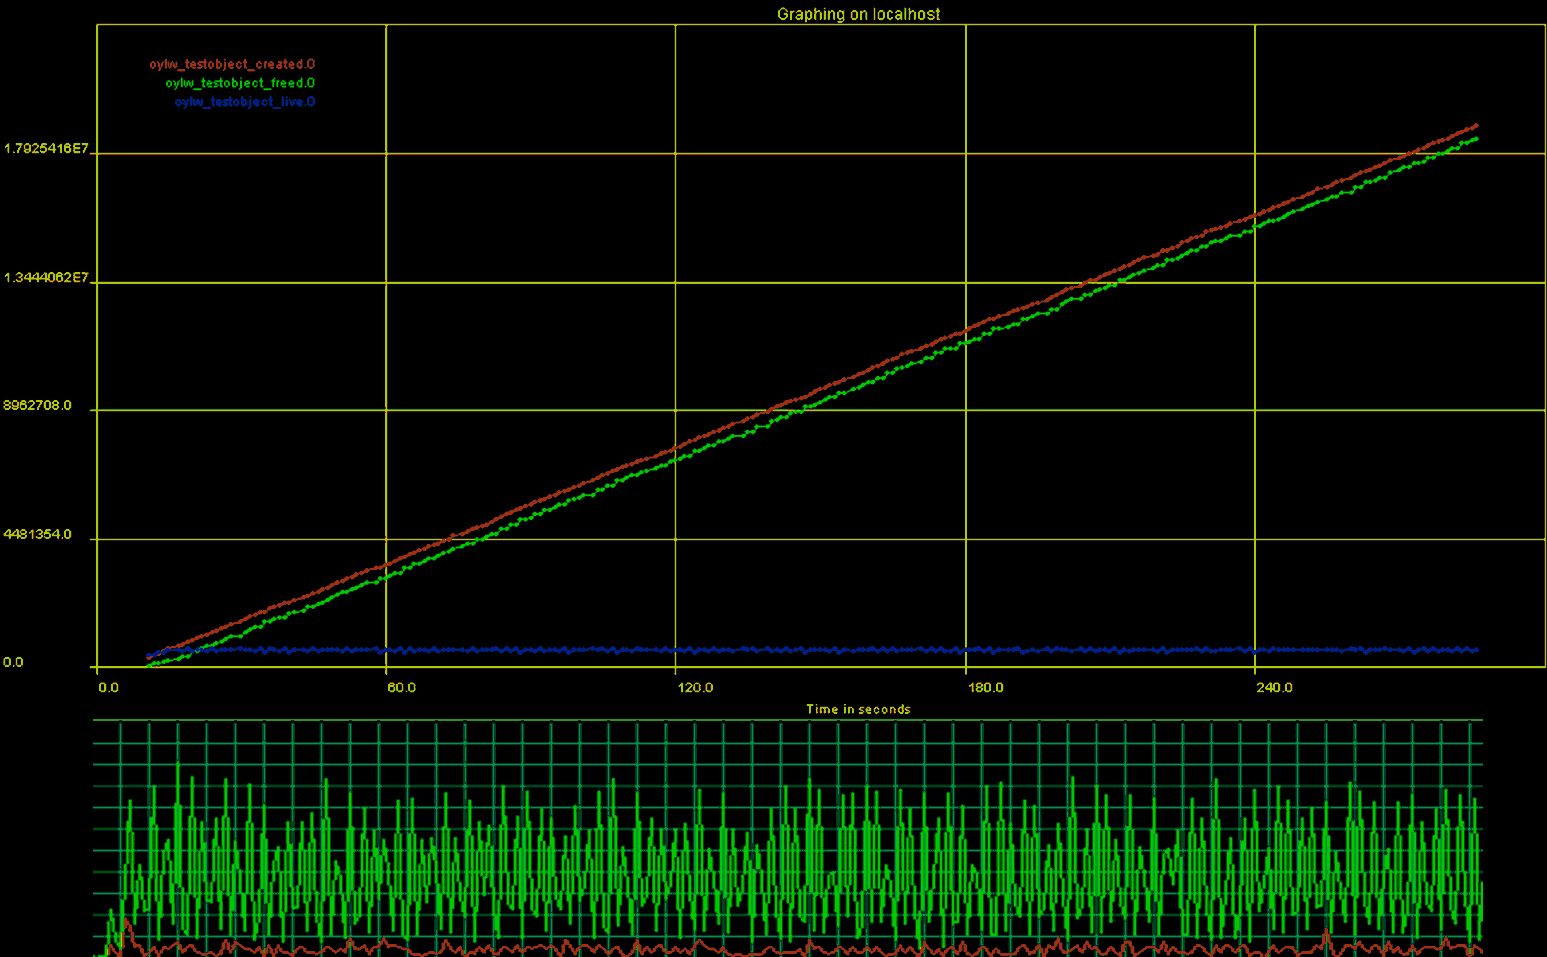
The test results are presented on Charts 1-5. The top portion of the chart reports "created" and "freed" counter values. The chart's X axis reports time from the beginning of the test in seconds. The Y axis shows the number of TestGCObject objects. The red line is the number of objects created. The green line is the number of objects garbage collected. The blue line is the number of live objects, i.e. the number of objects created minus the number of objects garbage collected. The bottom portion of the chart shows corresponding CPU usage in green and kernel times in red.
You can find a general discussion of the results and some of my personal thoughts below. But do not rush to the conclusions just yet... Take some time to compare the behavior of various garbage collection algorithms yourself. These charts tell a very interesting story! What is the best garbage collection algorithm?
Chart 1. Default garbage collection behavior.
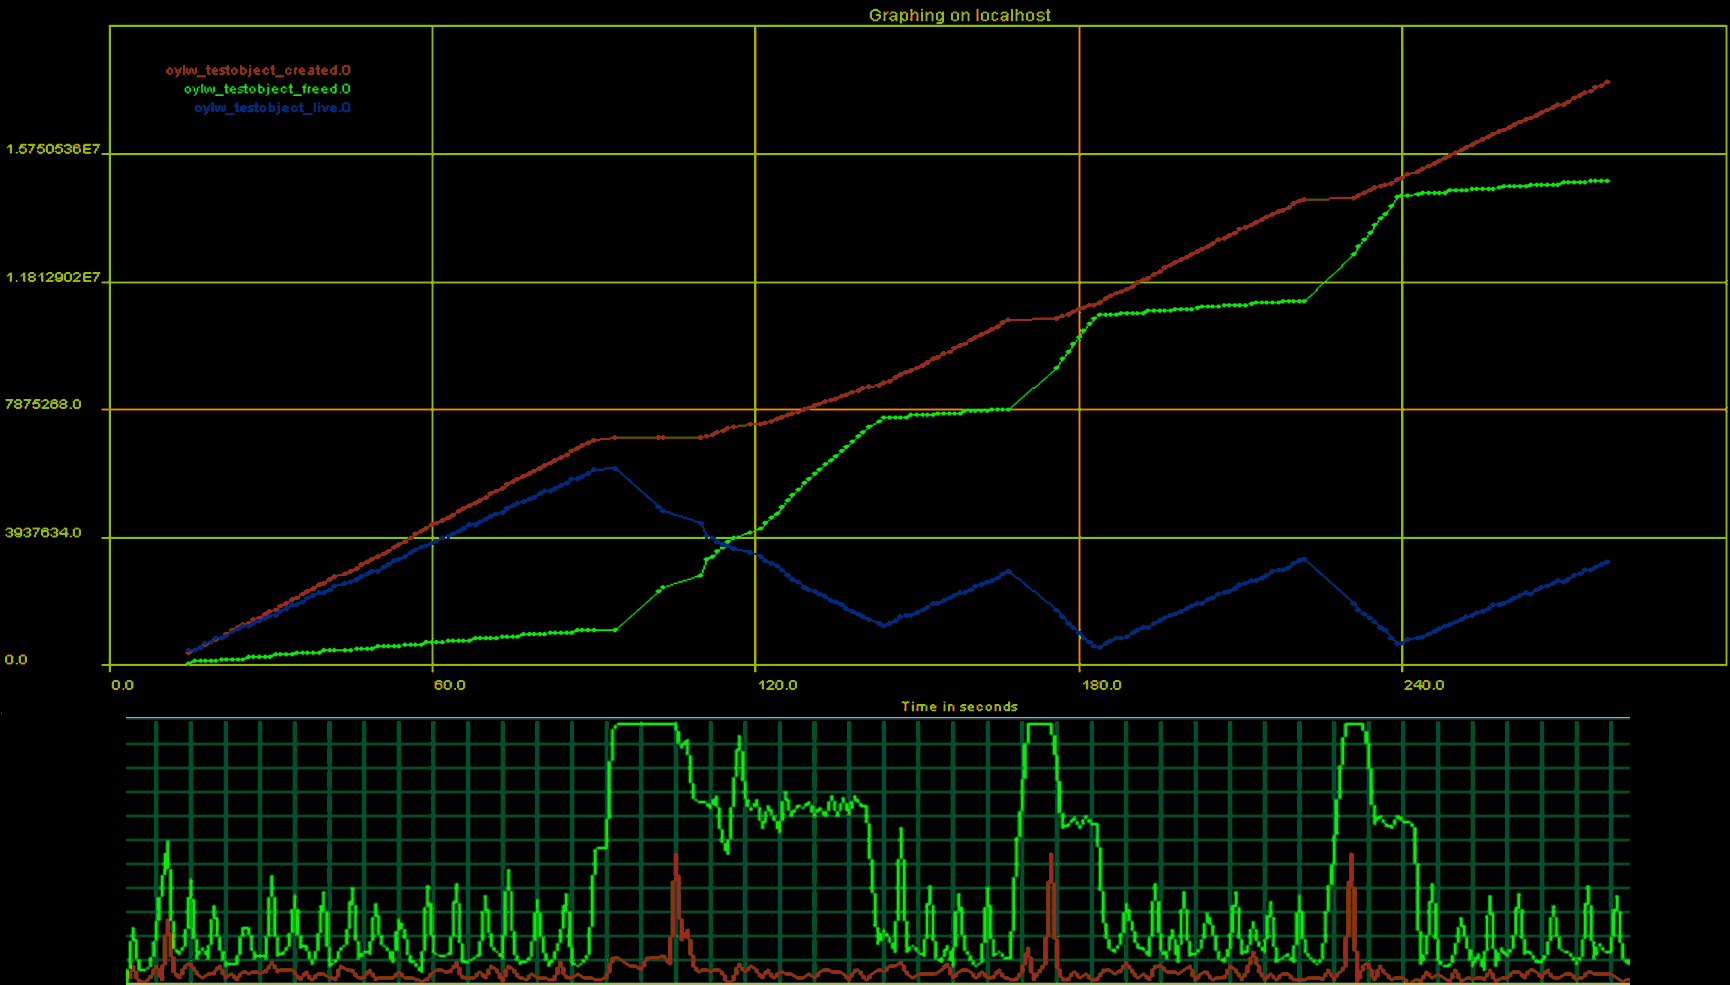
Chart 2. Parallel copying (-XX:+UseParNewGC) garbage collection behavior.
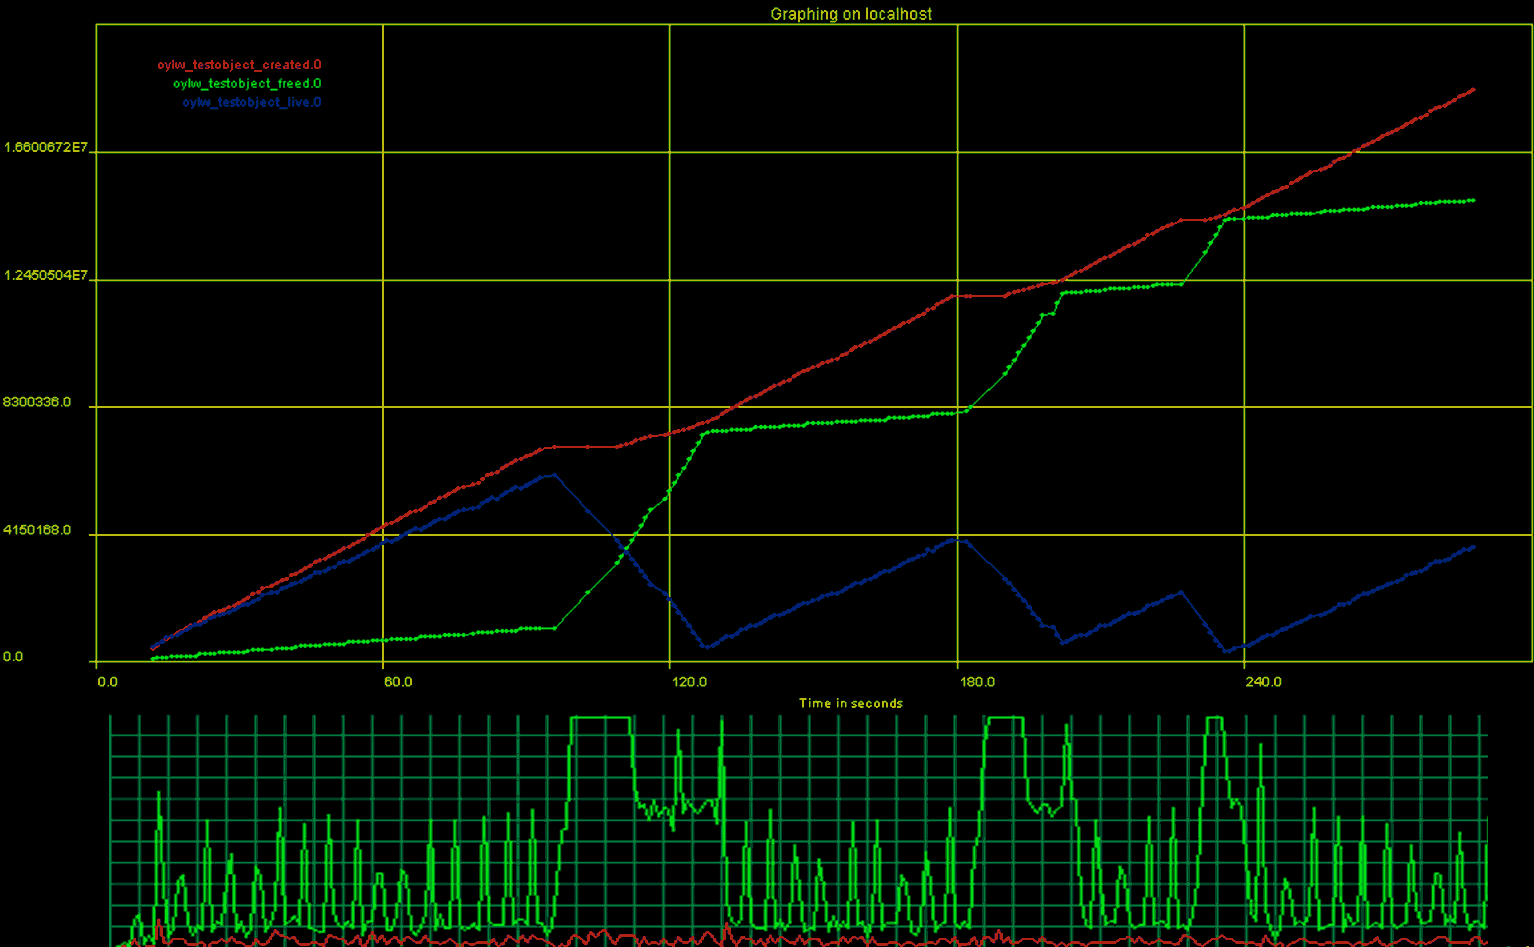
Chart 3. Incremental collector (-Xincgc) garbage collection behavior.
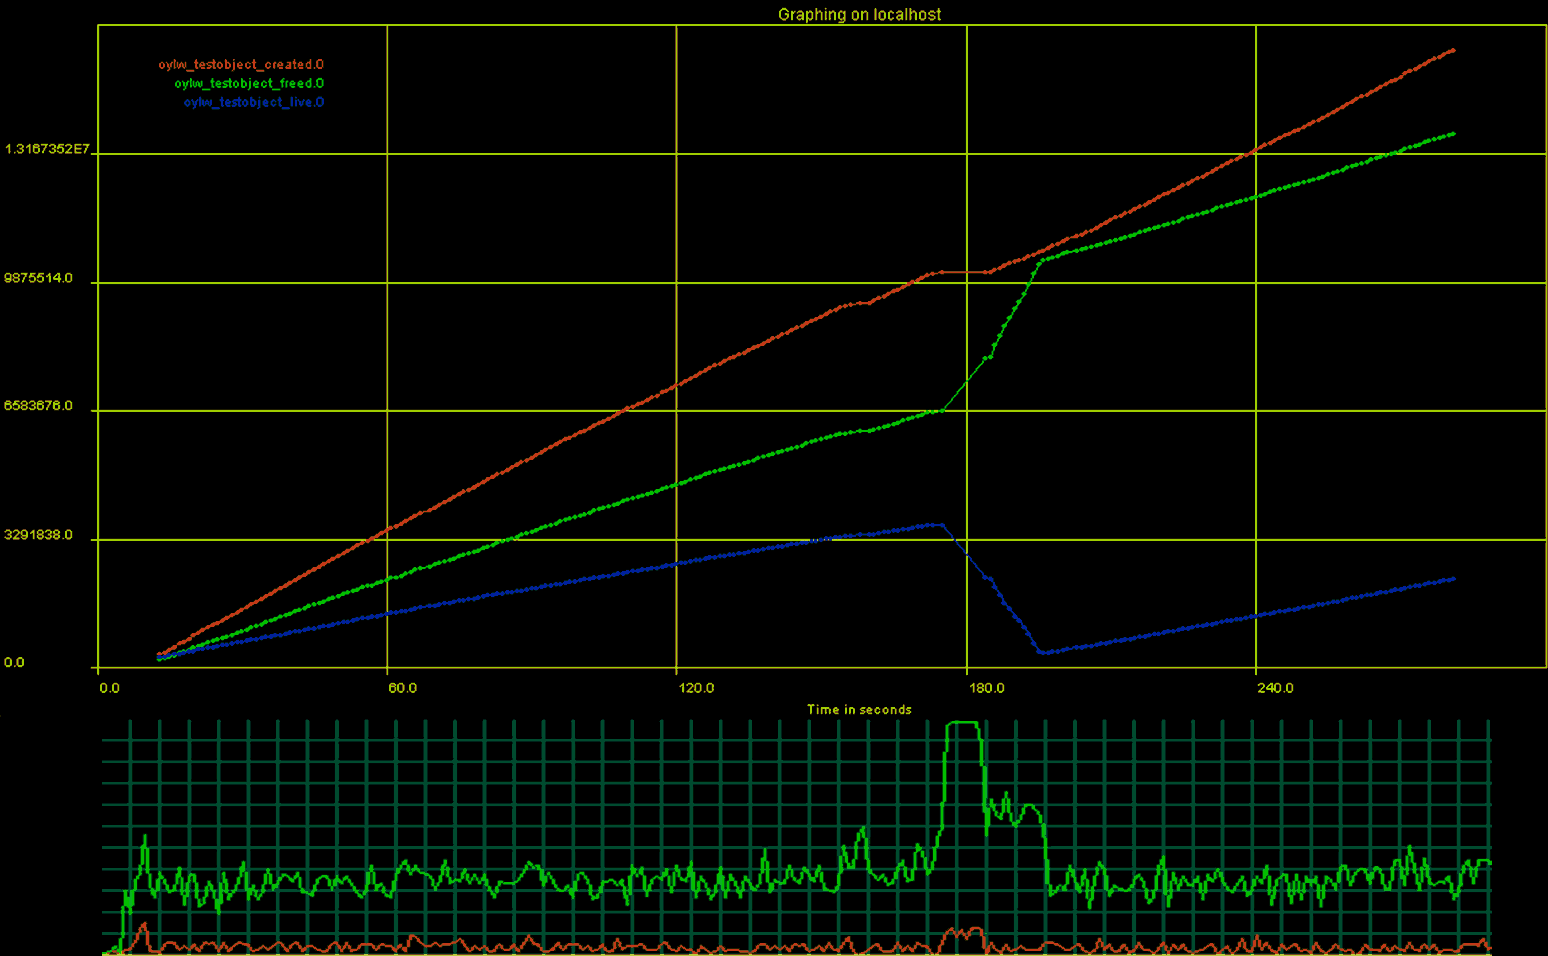
Chart 4. Concurrent mark-sweep (-XX:+UseConcMarkSweepGC) garbage collection.
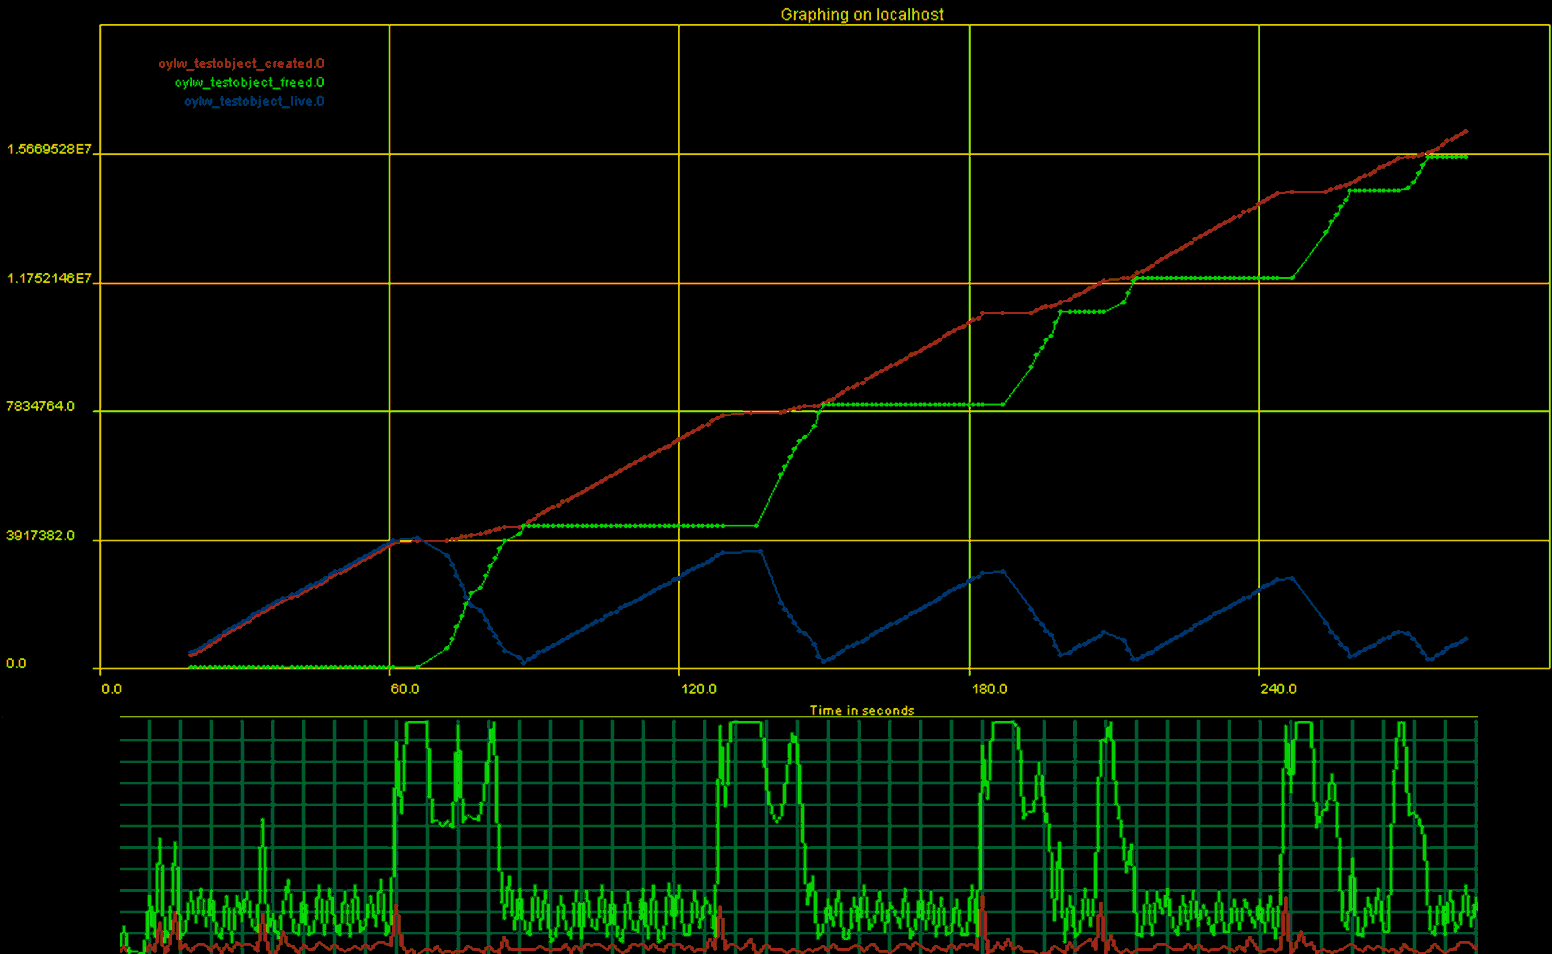
Chart 5. Parallel scavenging (-XX:+UseParallelGC) garbage collection behavior.
Discussion
The bottom line is that many garbage collection algorithms, including the default one, do not work well for my test application. It is clearly visible from Charts 1-4 that garbage collection occurs slower than object creation. I concluded this from the different slopes of the red and green lines. This can also be seen on the blue line - the number of live objects; we have a huge number of live objects that are actually not being used. With the default and the parallel copying algorithms, the garbage collection waits quite long to start collecting objects.
With incremental garbage collection the lag is smaller, but it still exists. Concurrent mark-sweep collects objects almost too frequently.
For these algorithms, the objects are created faster than they are garbage collected. This eventually results in the "stop the world" scenario - a complete stop of all application threads in order for garbage collection to proceed. You can see where "stop the world" occurred on the charts. The charts do not have any data points (just plain lines) in several sections 10-15 seconds in duration. At these moments, we were not even able to obtain counter values for the chart. A "stop the world" is bests observed on the CPU profile. When it occurs, 100% of the CPU is used for 10-15 seconds in duration, while only about 15-25% is used at other times when garbage collection does not run.
The behavior is quite different for parallel scavenging on Chart 5. Parallel scavenging is quite effective and garbage collects objects without noticeable delay right after they become eligible. The rate of objects creation is equal to the rate of garbage collection. Notice how both the red and green lines are parallel to each other. Also notice that the number of live objects (blue line) is quite low for the entire duration of the test. The CPU profile is quite nice - CPU usage is relatively the same for the entire duration of the test. Thus we can conclude that parallel scavenging garbage collection is the most well behaved in this test scenario. It also did the most useful work, comparing to all other test cases, creating almost 18,000,000 objects.
Following a common practice among members of medical profession, I have to tell you that "the choice is yours". I have done my best to show you how to put together a practical test to help your decision. My test, as any other test a doctor would order, improves your chances of making a full recovery, but does not guarantee it. Only you can decide what is best for your application. Making a decision is only half the battle. After you have made a decision you have to monitor your software at runtime to confirm whether application runs better.
The framework
The crucial thing we need to agree upon is that a certain type of software applications do need monitoring and performance counters in addition to all possible kinds of testing. The performance counters are designed to probe runtime behavior of a software system by observing changes of specific metrics in time. Without performance counters in the production code, these applications simply won't be accepted by the customers. Like a gun without a safety, a complex software application should not be produced without performance counters and monitoring capabilities built in. If you develop custom software components or software applications that have any of the high-risk high-complexity features, start adding self monitoring to your application as soon as possible. The garbage collection is just one of many subsystems that can be best understood and managed with real-time monitoring and performance counters.
If you think that only big boys like Microsoft, Oracle, IBM, Sun, or Cisco can afford built-in software monitoring, you are wrong. You can easily add performance counters and monitoring capabilities to your applications. The framework for adding and collecting counters can be very simple as you can see from my example. You can repeat the tests above and output counter values to the console once every second and then create charts manually... But being strongly turned off by manual work of this kind, I am working on Linguine Watch, open-source Java framework for adding performance counters to the large software applications {6}.
This framework helps one to quickly define and add application specific performance monitors, counters and gauges. It is also very effective for real-time data collection and introduces insignificant distortions.
With the help of Linguine Watch it is very convenient to define and collect the "created" and "freed" values from TestGCObject. Without any additional work or glue code, the counter values can be collected from the running Java application in a real-time using built-in SNMP agent or periodic file-based snapshots.
There is absolutely no manual work; even MIB files for your application are generated automatically.
The garbage collection test classes described here are also included in the Linguine Watch distribution, in the package com.oy.shared.lw.samples.gc. As you can see on Listing 3, the TestGCObject required minimal changes to use framework-based monitor object. To see the counters at work and to plot the counter values in real-time, AdventNet SNMP Utilities 4 package {7} can be used. This professional quality package has an MIB browser and good SNMP monitoring support in a limited-time free trial. Any other SNMP monitoring package will do as long as it supports a frequent enough collection policy (once every second in our case). Just run your SNMP monitoring application, connect to the running instance of the TestGCThread test via SNMP and you will see the chart in real-time. It is that easy!
Not a panacea in itself, performance monitoring is a crucial part of full software product development and deployment lifecycle. Achieving enterprise levels of software reliability and quality in simply not possible without performance counters. This is why all the big boys have it.
The final word
I was about to publish this article in March of 2006, but something told me to be very careful. It all looked almost too simple to be true. Why didn't other people do this before? Is this really the end of the garbage collection issues? Why did the Java folks at Sun invented all of these other algorithms when I found that only one worked? Something was wrong, I just was not sure what... Something told me to worry. I was worried, and I did not publish it.
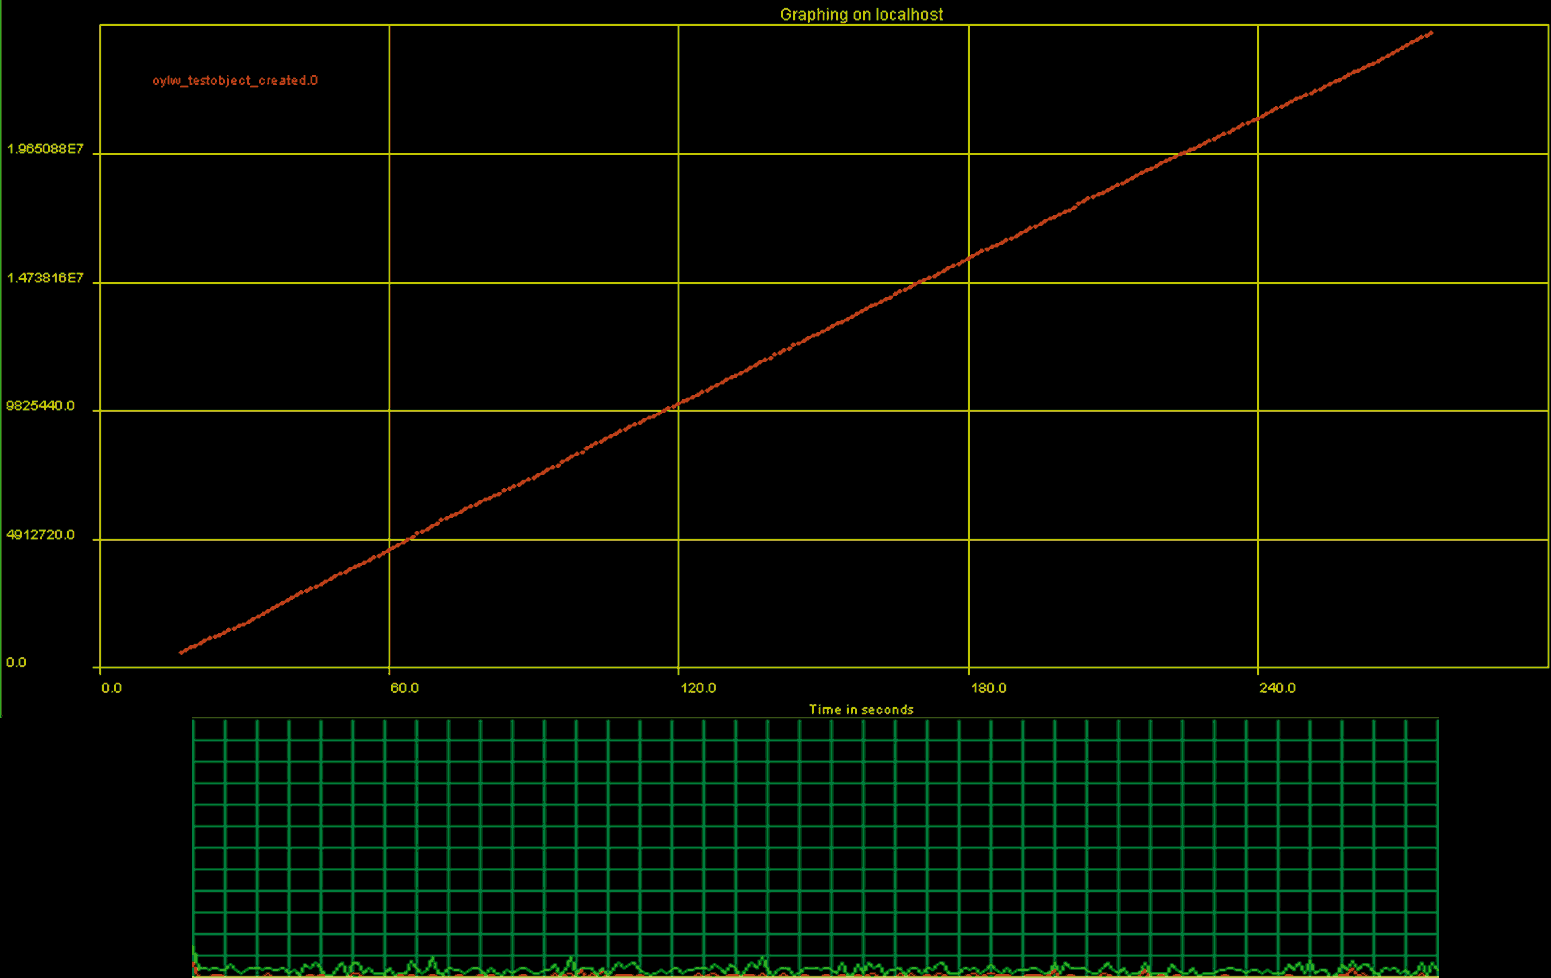
One day, three months later, all of it came clear. All the results I have presented here are not quite correct. It turns out that the simple fact of overriding the finalize() method dramatically changes garbage collection behavior! Adding finalize() method to TestGCObject has huge impact on garbage collection and the CPU usage during the test. If you do not override finalize() and only watch number of object created you would expect to get a chart similar to Chart 1. But what you do get instead is Chart 6 - perfect smooth behavior, no CPU spikes. So the garbage collection works quite differently for objects with and without the finalize() method!
This is bad news, because the monitoring you add to your application might disrupt the application's old behavior. But at the same time it is a good news! We are able to consistently improve our understanding of the software system using monitoring. We did not really know how the garbage collection worked or how to choose the garbage collection algorithm before we started our monitoring project. Now we still do not really know how it works deep inside, but we can use the monitoring results to properly pick the garbage collection algorithm and to build the software system that will not have "stop the world" pauses.
The real-time software monitoring is essential in building and smoothly running large distributed concurrent software applications. Monitoring allows for consistent gradual improvement of even the most complex systems. But before you run to your boss with the great results of your Java garbage collection tuning, do not forget to run the control experiments and establish the baseline.
Chart 6. Default garbage collection behavior while not overriding finalize() for TestGCObject.
Appendix A
Listing 1. Test thread that continuously creates TestGCObject instances.
Listing 2. Test objects that monitors its allocation and deallocation.
Listing 3. Test objects that monitors its allocation and deallocation using Linguine Watch framework.
Appendix B
The JVM version 1.4.2-b28 was used on Windows XP Pro in the tests. While reading a CPU profile, note that single Intel Pentium 3 GHz CPU with hyper-threading was used. If you find that some options or parameters are missing or differ from what your project uses - not a big deal.
Just repeat the same test I have described here in your own setting and see for yourself.
After all, it takes only minutes to try. It should be expected that JVM's from different vendors will behave differently.
The JVM command line options are specified for each case, always with 256 MB of memory (-Xms256M -Xmx256M). The duration of the test was around four minutes for each test. While the test was running, the values for "created" and "freed" counters were collected once every second and printed to the console. Later, the collected values were plotted on the chart. Additionally, CPU usage was recorded using Windows Task Manager.
References
- Tuning Garbage Collection with the 1.4.2 Java Virtual Machine

- Improving Java Application Performance and Scalability by Reducing Garbage Collection Times and Sizing Memory Using JDK 1.4.1

- J2SE 1.4.1 boosts garbage collection

- Java HotSpot VM Options

- Question of the month: 1.4.1 Garbage collection algorithms

- Linguine Watch performance monitoring framework
- http://www.adventnet.com

- http://bob.marlboro.edu/~msie/2003/ipl/ipl3-s6.html

- http://research.sun.com/projects/gcspy/printezis-garthwaite-ismm2002.pdf

